CIHR Internal Assessment - Report for the 2011 International Review
Part 2: CIHR's Budget
CIHR receives its budget primarily from funds voted annually by Parliament. Separate funding is voted for CIHR's administrative expenses (e.g., for staff salaries) and its grants and awards programs. CIHR's administrative expenses represent less than 6% of its total budget. All grants and awards funding must be expended by the end of the fiscal year12 as surplus funds cannot be carried over to future years. There are two budget components: 1. the "base" budget, whose allocation is fully at the discretion of GC; and 2. funding earmarked by the Government of Canada for specific programs such as for HIV/AIDS. This also includes CIHR's share of Tri-Council programs such as the Canada Research Chairs (CRC), the Networks of Centres of Excellence, the Centres of Excellence for Commercialization of Research (CECR) and the Banting and Vanier studentship programs. In the early 2000s, the significant amounts CIHR provided to NCE and CRC programs ($121 million in 2009–2010) were casually referred to as "flow-through funds." Now the view is that all CIHR funds, whether part of the base budget or the earmarked funds, should be applied to achieve CIHR's strategic plan. For example, research partnerships are being forged between NCEs and CIHR institutes. A good example is the Focus on Stroke training program, which is a partnership between the Canadian Stroke Network, the Heart and Stroke Foundation of Canada, and three CIHR institutes.
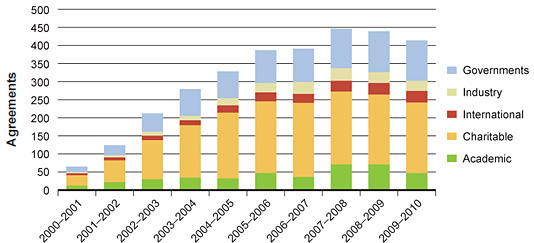
CIHR's overall budget has increased 2.5-fold since its inception (Figure 3A), and now stands at approximately $1 billion. In addition, CIHR has secured significant funding from more than 400 partner agreements, leveraging more than $100 million dollars in recent years (Figures 3B and 3C).
Figure 3: CIHR's budgets and partners
Figure 3A: Annual appropriations
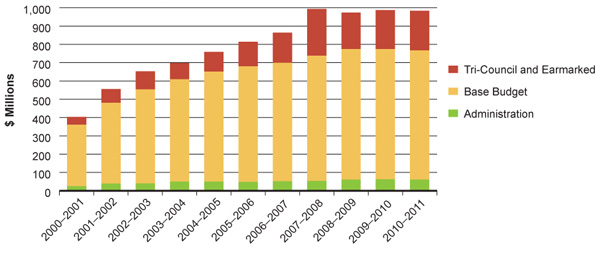
Figure 3B: Value contributed by partners
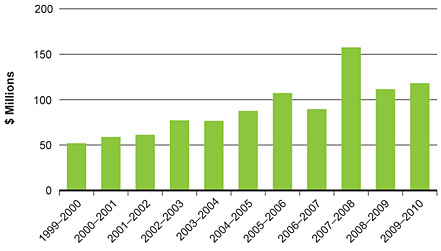
Figure 3C: Number of partnership agreements in force
Allocation of the budget
Figure 4A shows how the total budget, excluding CIHR's share of Tri-Council funding is spent on the various types of support that health research requires. The majority is spent on operating grants of various types, although training and salary programs are also significant. In 2006–2007, CIHR elected to no longer provide equipment – in part a recognition of the growing role played by the Canada Foundation for Innovation to support research infrastructure.
CIHR was founded to increase support for all four themes of health research. Figure 4B shows that funding across all research themes has increased over time. While the share of base budget spent to clinical research (theme 2), population health research (theme 4) and health services research (theme 3) have grown rapidly over the last 10 years (i.e., 4.6 times, 9.8 times and 11.1 times, respectively), the majority of funding remains allocated to support biomedical research (theme 1).13
Figure 4: Grants and awards expenditure
Figure 4A: Spend by program type
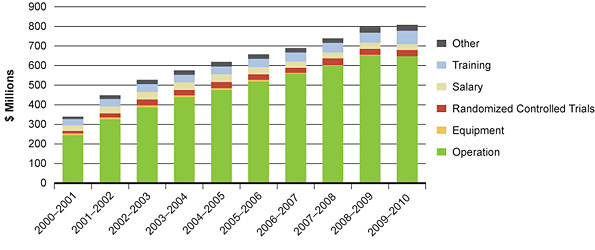
Figure 4B: Spend by theme
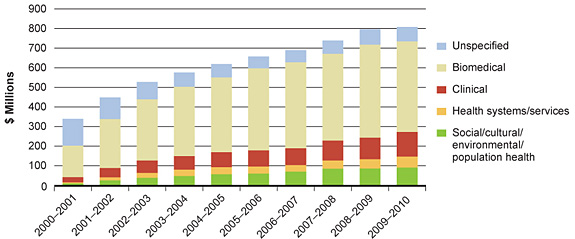
Figure 4C tracks the division of funding between "open" and "strategic." Open research reflects the priorities of individual researchers while strategic research reflects the stated priorities of CIHR and its institutes. The percentage of funding allocated to strategic initiatives has increased significantly since CIHR's inception, from below 11% to 33% today. These strategic initiatives are a mix of institute-led investments and increasingly pan-CIHR large strategic initiatives that are funded centrally.
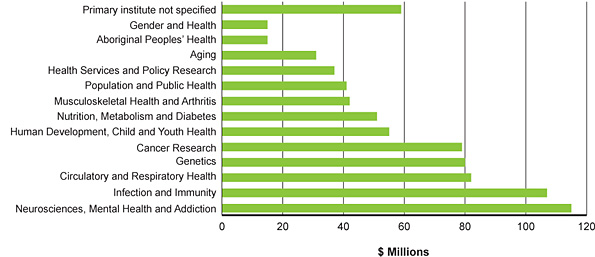
Figure 4D shows the value of all grants and awards (both open and strategic) in 2009–2010 by primary institute affiliation (as self-reported by the grant holders). The resulting data approximates the research capacity within the mandate of each institute. The distribution largely reflects Canada's strong historical funding of biomedical research, since the largest institutes are those that inherited a legacy of biomedical research from the Medical Research Council, while, for example, the Institute of Gender and Health and the Institute of Aboriginal Peoples' Health, had to build their communities of researchers largely from scratch.
Figure 4: Grants and awards expenditures (cont'd)
Figure 4C: Spend on open and strategic competitions
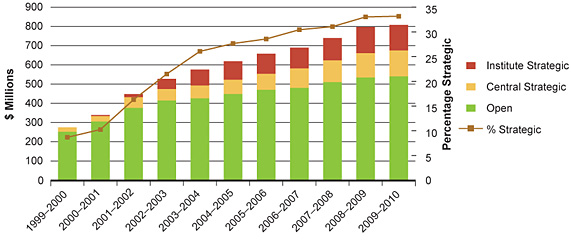
Figure 4D: Spend by institute affiliation, 2009–2010
Putting CIHR's budget into context
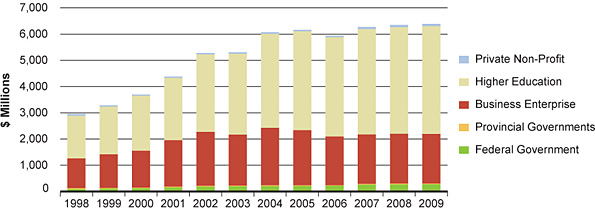
According to Statistics Canada,14 total health research funding in Canada was $6.4 billion in 2009–2010 (Figure 5A), with the higher education sector being the largest contributor in the form of the salaries of investigators. The second largest sector is Canadian business enterprise, but its proportional contribution has decreased over the past decade. The Government of Canada contribution is largely the CIHR budget. Private non-profit organizations, mainly the health charities, contributed $599 million in 2009–2010 and provincial governments, largely through their own funding agencies, $362 million. Support from foreign sources, such as the U.S. National Institutes of Health (NIH), the Bill and Melinda Gates Foundation and foreign industry, totalled $867 million.
Most Canadian health research takes place in the higher education sector (Figure 5B). Again, business enterprise ranks second, and its share has remained constant. Very little health research is performed by provincial government departments responsible for public health and health care services. A general feature of Canada's research and development (R&D) enterprise is that the value of research carried out by the higher education sector, expressed as a percentage of GDP, is second only to Sweden. In contrast, the relative value of research performed by business enterprise is low: on this indicator, Canada ranks 15th among OECD nations, well below the average.15
Figure 5: Canadian spending on health research 1998–2009
Figure 5A: Health R&D – funding sector
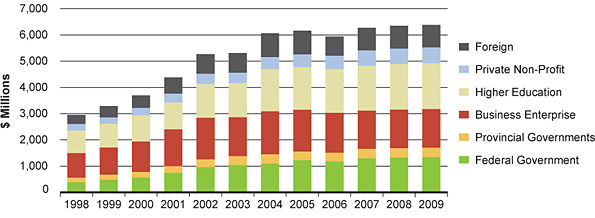
Figure 5B: Health R&D – performing sector
A notable feature of the Canadian environment for health research has been the increased investment by the Government of Canada over the past 13 years in a variety of new research funding programs intended to make Canada more competitive and attractive to international scientific talent. Figure 6 illustrates the distribution of federal funding programs for health research for the 2009–2010 fiscal year.
Figure 6: Federal health research funding programs, 2009–2010
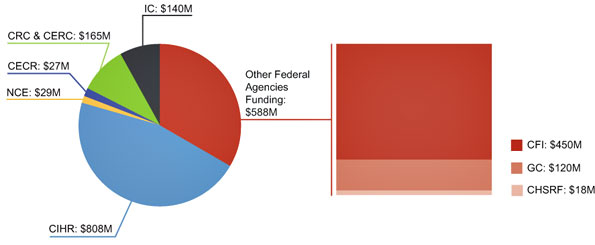
NCE: Networks of Centres of Excellence CIHR: Canadian Institutes of Health Research
CRC: Canada Research Chairs CECR: Centres of Excellence for Commercialization of Research
CERC: Canada Excellence Research Chairs CFI: Canada Foundation for Innovation GC: Genome Canada
CHSRF: Canadian Health Services Research Foundation IC: Indirect Costs
Another perspective from which to view the CIHR expenditures (including flow-through programs) is in relation to the cost of providing health care in Canada (i.e., $929 million, compared to $183 billion in 2009, or roughly 0.5%.16 Total public sector health research investment is less than 2% of health care costs.
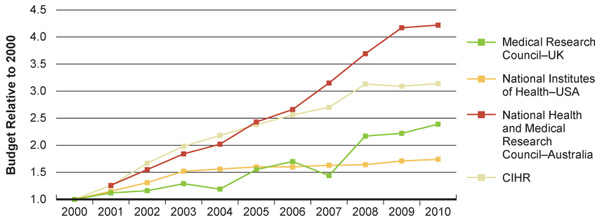
In comparison with budget increases over the decade for agencies in other leading health research nations, CIHR has done well (Figure 7).
Figure 7: Increases in budget since 2000 (=1) for national health research funding agencies
CIHR's grants and awards programs
Table 2 lists the major CIHR funding programs. The Open Operating Grant Program is the largest, a $405 million investment in 2009–2010, supporting 3,791 grants. There are 225 other active operating grant programs listed on CIHR's public database for 2009–2010.
Table 2: CIHR's major program types, or funding schemes, 2009–2010
| Program | Details | # | % of Budget |
|---|---|---|---|
| Open Operating Grants | To support research proposals by individuals and self-assembled teams in all areas of health research. | 3,791 | 43.5 |
| Catalyst Grants | To generate preliminary data, validate methodology or tools, and/or explore novel research ideas. | 254 | 1.6 |
| Team/Emerging Team Grants | To support collaborative research addressing an important health issue. | 174 | 9.1 |
| Randomized Controlled Trials (RCTs) | To support experiments which test the efficacy or effectiveness of health care services or health technologies. | 81 | 3.3 |
| Commercialization and Industry-partnered Grants | To encourage collaboration between academia and industry and assist researchers with commercialization of intellectual property. | 117 | 3.0 |
| Knowledge Translation Grants | To support all aspects of the translation of research finding into improved health for Canadians, more effective health services and a strengthened health care system. | 157 | 1.4 |
| Other Operating Grants | Includes: international partnerships, large strategic programs, and institute-specific funding programs. | 1,054 | 15.1 |
| Subtotal | 77.0 | ||
| Salary Awards | To support researchers through a contribution to their salary. | 1,219 | 12.7 |
| Subtotal | 12.7 | ||
| Studentships/Fellowships | Stipend for highly qualified candidates who are pursuing an MSc or PhD degree, or post-PhD studies in a health-related field in Canada or abroad. | 2,734 | 7.3 |
| Training Programs | Awarded to a group of excellent mentors who collaborate to offer an interdisciplinary research training program. | 57 | 1.5 |
| Subtotal | 8.8 | ||
| Miscellaneous | Various small grants and awards programs | 453 | 1.5 |
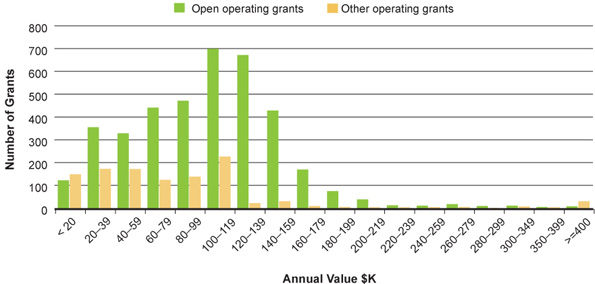
Figure 8 shows the distribution of grant values (amount per year) for 2009–2010, with open operating grants shown in green shading. The median open operating grant value (as measured by the actual amount expended that fiscal year for all new grants awarded that year) is $107,000 (average $104,000), whereas the median grant value for other operating grants is $77,000 (average $152,000). The latter include grants classified as operating grants but that do not fall within the Open Operating Grant Program such as institute-led funding programs, partnered research grants and grants linked to CIHR research initiatives. There are some large strategic team grants, raising the average value, but the majority of strategic grants are much smaller than open operating grants. This proliferation of small programs is being reviewed through a new approach to strategic investment planning at Scientific Council, including limiting the number of initiatives an institute can launch independently to one per year.
Figure 8: Annual value of operating grants (all programs), 2009–2010
In 1999–2000, the median value of an open operating grant was $67,000. Using the NIH Biomedical Research and Development Price Index17 as the inflator, today's median grant would be worth $73,700 in 1999 dollars (Table 3), so there has been a real increase in the value of these grants. Since most materials and supplies have to be imported from the U.S., the recent rise in the value of the Canadian dollar has further increased the purchasing power of CIHR grants. Although CIHR grants may seem small in comparison to those of the NIH, they exclude investigator salaries and institutional overhead. A separate Tri-Council Indirect Costs Grant program provides $325 million a year to research institutions. The allocation of these funds is based on the grants they receive from the Tri-Councils, using a sliding scale that ranges from 80% to 20% of direct costs, with smaller institutions receiving the higher rates.
The number of grants and awards has increased over the past 11 years, as shown in Table 3. The greatest increases have been in Salary Awards, which have more than doubled in number, due to the advent of the Canada Research Chairs. The apparently modest increase in the number of open operating grants (1.7 times) does not include all the other types of operating grants; taking these into account the total number of operating grants has increased two-fold. Although the number of funded randomized control trials is unchanged, the median value of funded trials has increased almost six-fold. Taking inflation into account, the real value of CIHR's doctoral research awards and postdoctoral fellowships have declined, although there have been significant increases in the number of awards.
Table 3: Comparison of number and value of grants and awards, 1999–2000 and 2009–2010
| Program Type | 1999–2000 | 2009–2010 | Notes | |||
|---|---|---|---|---|---|---|
| # | Annual Value | # | Annual Value | Value in 1999–2000, $ | ||
| Open Operating Grants | 2,285 | $67,000 | 3,791 | $107,000 | $73,700 | Median value of an open operating grant, inflate using NIH Biomedical Research and Development Price Index (BRDPI). |
| Randomized Controlled Trials (RCTs) | 81 | $50,000 | 81 | $296,500 | $204,200 | Median value, inflate using NIH BRDPI. |
| Salary Awards | 497 | $50,000 | 1,219 | $60,000 | $41,300 | Includes Canada Research Chairs: value shown is for CIHR New Investigator Award, inflate using Consumer Price Index (CPI). |
| Postdoctoral Fellowships | 564 | $35,000 | 744 | $40,000 | $24,500 | Stipend for PhD holder, inflate using CPI. |
| Doctoral Research Awards | 750 | $19,000 | 1,270 | $21,000 | $14,500 | Includes Canada Graduate Scholarships: value shown is for CIHR Doctoral Research Award, inflate using CPI. For 2010–2011 value of stipend raised to $30,000. |
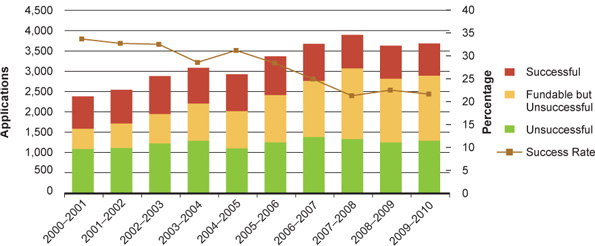
For all CIHR's annual open grants and awards competitions, an increase in application pressure has exceeded the growth in program budgets, resulting in declines in competition success rates, as illustrated by Figure 9 for open operating grants. However, several factors have mitigated this decline. The first is that many institutes fund or partially fund additional operating grants that are close to the pay line through the mechanism of Priority Announcements (PA). These are published well in advance of the competition deadline and describe areas of enquiry or types of grants that an institute wishes to encourage. Furthermore, in order to accommodate as many meritorious applications as possible, CIHR imposes across-the-board cuts to the budgets recommended by its peer review committees; for the last four competitions these have averaged 14%. Going forward, CIHR intends to ensure that the value of its operating grants grows with general inflation.
Finally, it should be noted that as there are two operating grant competitions per year, and applications may be submitted an unlimited number of times, the eventual success rate by application is much higher than the success rate by competition.18
Figure 9: Applications to open operating grants competitions
- Date modified: