Postdoctoral Fellow Peer Review Pilots
CIHR is committed to supporting the development of the next generation of health researchers by accelerating their research independence and leadership. Given that, developing peer review skills through hands-on experience is important for the career development of emerging researchers, CIHR invited postdoctoral fellows (PDFs) to participate as reviewers for the Doctoral Research Award (DRA) competitions.
The objectives of these pilots were:
- To give PDFs an opportunity to develop their peer review skills;
- To assess the proficiency of PDFs as peer reviewers within the DRA program; and
- To determine how best to support the peer review experience and quality of PDFs; including the need for updated learning resources.
Two pilot studies were conducted through the 2016 and 2017 DRA competitions.
- The first pilot provided data on Banting PDFs serving as reviewers in the 2016 DRA competition. Overall, the results of the pilot indicated that PDFs who were offered the peer reviewer training served as appropriate reviewers. The follow-up survey indicated that PDFs found the peer review experience to be useful for their future. Detailed results can be accessed below.
- The second pilot was expanded to include Banting and CIHR PDFs serving as reviewers in the 2017 DRA competition. Similar to the results from pilot #1, pilot #2 indicated that PDFs serve as appropriate reviewers. The follow-up survey indicated that PDFs found the peer review experience to be useful for their future. Detailed results can be accessed below.
Postdoctoral Peer Review Pilots 1 and 2
Methods
Reviewer Groups: As per the DRA competition review process, each application was reviewed by two reviewers. In each pilot, there were two reviewer groups: a Regular-Regular group that only included experienced reviewer pairs with previous experience of reviewing; and a PDF-Regular group consisting of one PDF reviewer and one experienced reviewer with more than 2 years of review experience. In the PDF-Regular reviewer group, each application was assigned a maximum of one PDF reviewer.
Reviewer Participation: Overall, 1175 and 1205 applications were received in 2016 and 2017 DRA competition, respectively. In pilot 1 (2016 DRA competition), a total of 238 reviewers participated, of which 47 were Banting PDFs. In pilot 2 (2017 DRA competition), a total of 250 reviewers participated, of which 50 were PDFs (23 Banting PDFs and 27 CIHR PDFs). In both pilots, PDFs were provided with standard peer reviewer training available to all reviewers.
| Pilot 1 (2016 DRA Competition) |
Pilot 2 (2017 DRA Competition) |
|
|---|---|---|
| Total number of applications | 1175 | 1205 |
| Total number of reviewers | 238 | 250 |
| Number of Regular reviewers | 191 | 200 |
| Number of PDF reviewers (BPF, MFE) | 47 | 50 (23, 27) |
| Percent of reviewers who are PDFs | 20% | 20% |
BPF = Banting postdoctoral fellows |
||
The overall success rate for the 2016 and 2017 DRA competitions was 13%.
Reviewer Workload: In pilot 1, both reviewer types (Regular or PDF) were assigned an average of 10 applications. In pilot 2, Regular reviewers were assigned an average of 10 applications compared with an average of 9 applications assigned to PDF reviewers.
Stages of Review: An application within the DRA competition can undergo up to three review stages depending on how discrepant the scores are between the two reviewers.
Figure 1: The three review stages that a DRA application can undergo depending on the reviewer scores. The pilot studies followed the same three-staged review process.
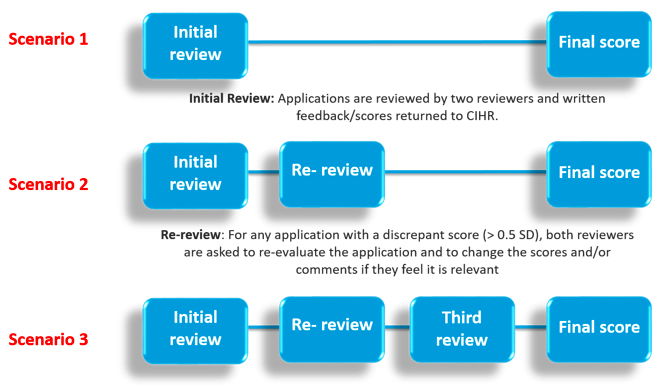
Figure 1 – long description
Review Process of the DRA competition. An application within the DRA competition can undergo up to three review stages depending on how discrepant the scores are between the two reviewers.
- Initial Review: Applications are reviewed and written feedback/scores returned to CIHR.
- Re-Review: For any application with a discrepant score (i.e. ˃ 0.5 difference), both reviewers are invited to re-evaluate the application and to change the scores and/or comments if they feel it is relevant.
- Third Review: Any application that still has a discrepant score following the re-review process is sent to an impartial third experienced Regular reviewer for assessment.
Both the Regular-Regular group and the PDF-Regular group were involved in all stages of review. In cases where applications were re-reviewed, the PDF reviewers were encouraged to reach out to their assigned mentors (who were always reviewers with two or more years of DRA review experience) and/or CIHR staff for any questions or concerns. For applications where score discrepancy could not be resolved through the re-review process, the third reviewer was always an experienced reviewer.
At the end of each pilot study, a survey was conducted where both reviewer types were invited to provide feedback on their overall experience. Recommendations from the survey results of pilot 1 informed the training materials of the pilot 2 and were incorporated accordingly.
Results
CIHR analyzed the competition data of the 2016 and 2017 DRA competitions to compare the review behavior of the PDF reviewers to that of the experienced Regular reviewers. The analysis was conducted at each of the three review stages. Table 2 outlines the types of analyses conducted. Results from the survey were analyzed separately. For pilot 1, an additional qualitative analysis was additionally conducted to compare the quality of the reviews.
| A. Quantitative Analysis: By Review Stage (Pilot 1 and Pilot 2) | ||
|---|---|---|
| DRA Competition Process Description | Analysis Performed | |
| 1. Initial Review | Applications are reviewed and scores/written feedback returned to CIHR. |
|
| 2. Re-Review | For any application with discrepant scores (i.e. ˃ 0.5 SD difference), both reviewers are asked to re-evaluate the application and to change the scores and/or comments if they felt it was relevant. |
|
| 3. Third Review | Any application that still has a discrepant score following the re-review process, CIHR asks a third, impartial reviewer to review the application and assign a score. |
|
| B. Qualitative Analysis (Pilot 1 only) | ||
| 4. Comparison of the quality (robustness and utility) of reviewer written assessments | ||
| C. Survey Analysis (Pilot 1 and Pilot 2) | ||
| 5. Reviewer feedback analysis | ||
-
A. Comparison of the Reviewer Scoring Behavior – Quantitative Analysis
Table 3 provides the number of applications assigned to each reviewer group and the proportion of applications that underwent each review stage by each reviewer group in the two pilots.
Pilot 1 Pilot 2 Reviewer groups Regular – Regular Reviewers PDF – Regular Reviewers
(PDF = BPF)
Regular – Regular Reviewers PDF – Regular Reviewers
(PDF= MFE + BPF)
Number of applications reviewed 683 492 740 465 Number (%) of applications assigned for re-review 42
(6%)26
(5%)55
(7%)22
(5%)Number (%) of applications assigned for 3rd review 12
(2%)13
(3%)12
(1.6%)1
(0.2%)Initial Review Stage
Figure 2: A comparison of the average weighted scores between PDF and Regular reviewers to common applications. In both pilots, PDF reviewers assigned lower initial scores compared to Regular reviewers (p< 0.001).

Figure 2 – long description
A comparison of the average weighted scores between PDF and Regular reviewers to common applications. In both pilots, PDF reviewers assigned conservative initial scores compared to Regular reviewers (p< 0.001). Paired t-tests were used to compare the PDF and Regular reviewer scores among commonly-scored applications.
- In pilot 1, of the 492 applications scored by PDF-Regular reviewer pairs, PDF reviewers awarded an average score of 3.97, while Regular reviewers awarded an average score of 4.13. The difference between the PDF reviewer and Regular reviewer scores was 0.16, statistically significant (p < 0.001).
- In pilot 2, of the 465 applications scored by PDF-Regular reviewer pairs, PDF reviewers awarded an average score of 3.98, while Regular reviewers awarded an average score of 4.13. The difference between the PDF reviewer and Regular reviewer scores was 0.15, statistically significant (p < 0.001).
Pilot 1
(492 Applications)Pilot 2
(465 Applications)PDF Reviewers Regular Reviewers PDF Reviewers Regular Reviewers Average Weighted Score 3.97 4.13 3.98 4.13 Standard Error 0.02 0.02 0.02 0.02 Figure 3: A comparison of score distribution between PDF reviewers and Regular reviewers on common applications. PDF reviewers span more of the scoring spectrum (broader scoring spread) as instructed in the reviewer guide. Overall, the PDF scoring behavior overlaps with that of the Regular reviewers.

Figure 3 – long description
Green represents the overlap in scores between PDF and Regular reviewers. The PDF reviewer scores (blue) overlap well with the Regular reviewer scores (yellow).
- In pilot 1, both reviewer types score approximately the same number of applications between 3.8 and 4.2, however PDF reviewers scored more applications lower than 3.8 and Regular reviewers scored more applications above 4.2.
- In pilot 2, both reviewer types score approximately the same number of applications between 3.8 and 4.2, however PDF reviewers scored more applications lower than 3.8 and Regular reviewers scored more applications above 4.0.
Re-Review Stage
For applications where two reviewers’ scores are 0.5SD discrepant, CIHR asks both reviewers to re-review their assigned score.
Proportion of applications: Consistent in both pilot studies, the PDF-Regular reviewer pair generated a smaller proportion of applications for re-review [pilot 1: 5% (PDF-Regular) vs 6% (Regular-Regular); pilot 2: 5% (PDF-Regular) vs 7% (Regular-Regular), not significant] indicating that PDF reviewers performed at par with experienced reviewers. See table 3 above.
Scoring Flexibility: In terms of changing score during re-review, pilot 1 PDF reviewers altered their initial score to a greater degree compared to Regular reviewers (p<0.05); whereas in pilot 2, PDFs were equally as flexible in moving away from their initial score as experienced Regular reviewers.
Figure 4: A comparison of the absolute change in score between PDF reviewers and Regular reviewers to common applications requiring re-review.
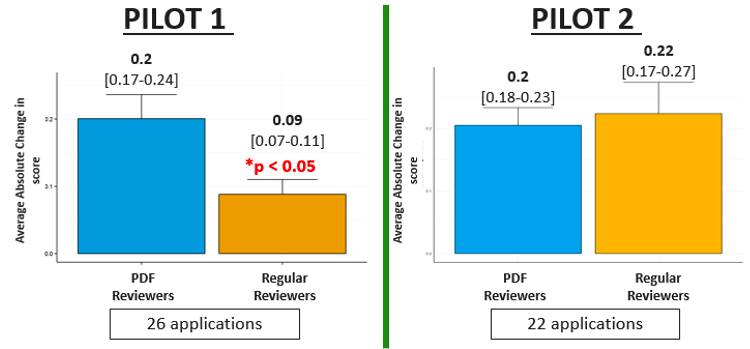
Figure 4 – long description
- Pilot 1: Of the 26 applications that were commonly re-reviewed by PDF and Regular reviewers, PDF reviewers altered their initial score to a greater degree following re-review (average absolute change 0.2 for PDFs and 0.09 for RR, p<0.05).
- Pilot 2: Of the 22 applications that were commonly re-reviewed by PDF and Regular reviewers, PDFs altered their initial score to a similar degree as regular reviewers (average absolute change 0.2 for PDFs and 0.22 for RR). No significant difference was observed between the initial average score and the re-review score for either reviewer type.
Error bars represent the standard error of the mean. Paired t-test was used to compare initial and re-reviewed scores.
Third Review Stage
In the case where discrepant scores could not be resolved through the re-review process, CIHR requested a third, impartial reviewer (who was always an experienced reviewer) to review the application and assign a score.
Proportion of applications: PDFs demonstrated proficient peer reviewer abilities for both pilots. In pilot 1, PDF-Regular pair’s performance was at par with Regular-Regular reviewer pair [3% (PDF-Regular) vs 2% (Regular-Regular), no significant difference]. In pilot 2, PDF-Regular pair demonstrated significantly improved performance with respect to the proportion of applications requiring a third reviewer (*p<0.05). Notably, only 1 application underwent third review from the PDF-Regular reviewer group as compared to 12 applications requiring third review from the Regular-Regular reviewer group [0.2% (PDF-Regular) vs 1.6% (Regular-Regular), p<0.05] (See table 2).
Scoring comparison: Average scores for PDF reviewers and Regular reviewers vs Third reviewer scores: This analysis could only be performed for pilot 1 given that only 1 PDF reviewed application underwent the third review stage in pilot 2.
Figure 5: A comparison of the average re-reviewed score between Regular, PDF and Third reviewers to common applications (Pilot 1 only).
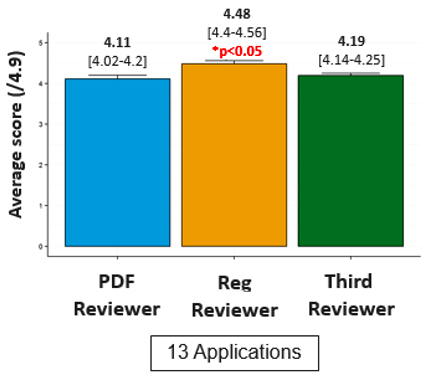
Figure 5 – long description
- For pilot 1, the re-review scores of PDFs were closer to that of the third reviewer as compared to the Regular reviewer re-review scores. Of those applications containing PDF reviewers that required a third review (n=13), the average Third reviewer score (4.19) was significantly lower than the average Regular re-reviewed reviewer score (4.48, p<0.05) but not significantly different than the average PDF re-reviewed reviewer score (4.11, p>0.05).
- For pilot 2, given that only a single application reviewed by PDFs underwent third review, the size of the group was insufficient to perform statistical analysis.
-
B. Comparison of the Review Quality – Qualitative Analysis of Reviewer Written Assessments (Pilot 1 only)
The CIHR Reviewers’ Guide for Doctoral Research Awards (DRA) asks peer reviewers to “highlight the strengths and weaknesses of each adjudication criteria” in their written assessments to applicants. According to the College of Reviewers Review Quality Guide, the quality of a review is characterized by its (1) appropriateness, (2) robustness, and (3) utility. CIHR analyzed the reviewer statements to compare the assessments provided by PDF reviewers versus Regular reviewers with respect to:
- Robustness, as determined by word count, use of all pre-determined adjudication criteria (see Figure 6) and identification of strengths and weaknesses
- Utility, as determined by the provision of advice
Figure 6 shows the Doctoral Research Awards Adjudication Criteria and Sub-Criteria.
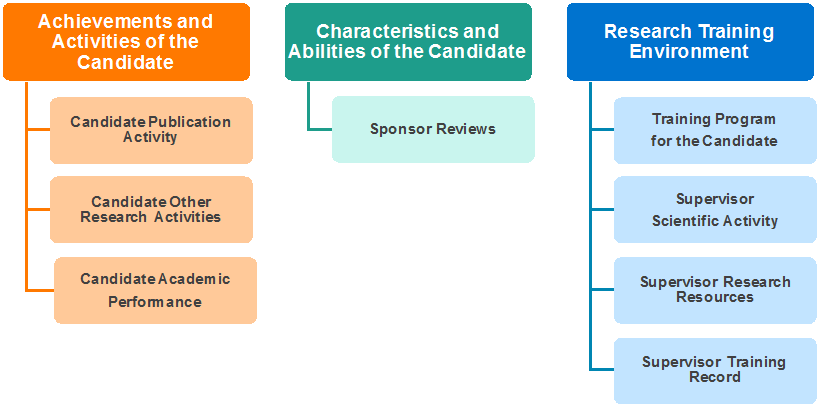
Figure 6 long description
DRAs are currently assessed by peer reviewers using pre-defined adjudication criteria and sub-criteria. The three adjudication criteria are:
- Achievements and activities of the candidate is further subdivided into three sub-criteria that assess candidate’s 1) publication activity, 2) other research activities and 3) academic performance.
- Research training environment is assessed by four sub-criteria. i.e. 1) training program of the candidate, 2) supervisor scientific activity, 3) supervisor research resources and 4) supervisor training record.
- Characteristics and abilities of the candidate is assessed by sponsor reviews.
Full detail of the adjudication criteria can be found in the CIHR Reviewers’ Guide for Doctoral Research Awards.
This analysis was carried out on 70 randomly-selected funded and unfunded applications meeting the following inclusion criteria:
- Assigned to one PDF and one Regular reviewer pair
- Assigned to the Biomedical Peer Review Committee
- Did not undergo re-review or a third review
Sample characteristics
Table 4 shows the number of Regular and PDF reviewers included in the sample of 35 funded and 35 unfunded applications.
Funded Applications (N=35) Unfunded Applications (N=35) Regular Reviewer PDF Reviewer Regular Reviewer PDF Reviewer Number of Reviewers 26 20 30 23 Total Number of Reviewers 46 53 Number of Assessments 35 35 35 35 Total Number of Assessments 70 70 A. Robustness
Criterion 1: Word Count
Figure 7 shows the average word count in assessments provided by Regular versus PDF reviewers across funded and unfunded applications.
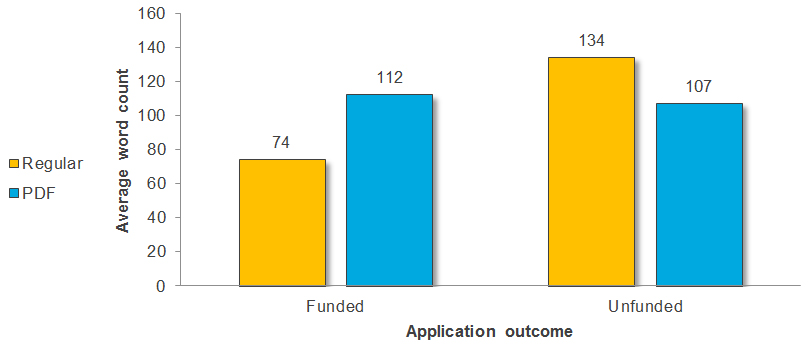
Figure 7 long description
Average, minimum and maximum word count in assessments provided by Regular versus PDF reviewers across funded and unfunded applications.
Funded Applications Unfunded Applications Regular Assessment PDF Assessment Regular Assessment PDF Assessment Average 74 112 134 107 Minimum 0 0 0 0 Maximum 291 336 606 546 Criterion 2: Use of pre-determined adjudication criteria
Figure 8 shows the percentage of Regular versus PDF assessments that commented on all of the DRA adjudication criteria across funded and unfunded applications.
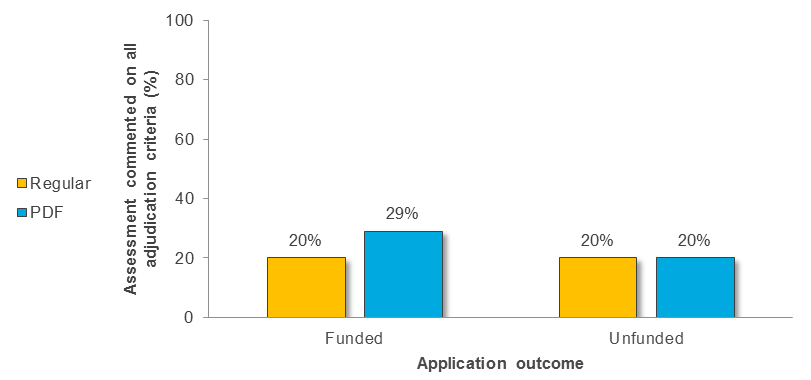
Figure 8 long description
Number and percentage of assessments provided by Regular versus PDF reviewers that commented on all of the DRA adjudication criteria across funded and unfunded applications.
Funded Applications Unfunded Applications Regular Assessment (N=35) PDF Assessment (N=35) Regular Assessment (N=35) PDF Assessment (N=35) Number of Assessments 7 10 7 7 Percent of Total Assessments 20% 29% 20% 20% Figure 9 shows the percentage of Regular versus PDF assessments that commented on the “Achievements and Activities of Candidate” criterion across funded and unfunded applications.
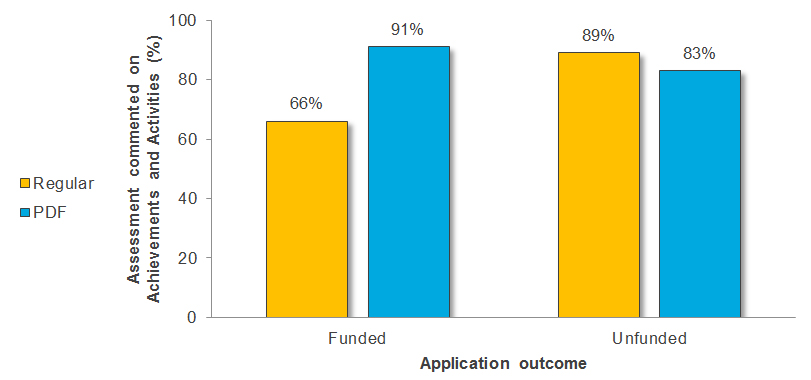
Figure 9 long description
Number and percentage of assessments provided by Regular versus PDF reviewers that commented on the “Achievements and Activities of Candidate” criterion across funded and unfunded applications.
Funded Applications Unfunded Applications Regular Assessment (N=35) PDF Assessment (N=35) Regular Assessment (N=35) PDF Assessment (N=35) Number of Assessments 23 32 31 29 Percent of Total Assessments 66% 91% 89% 83% Figure 10 shows the percentage of Regular versus PDF assessments that commented on the “Sponsor Reviews” criterion across funded and unfunded applications.
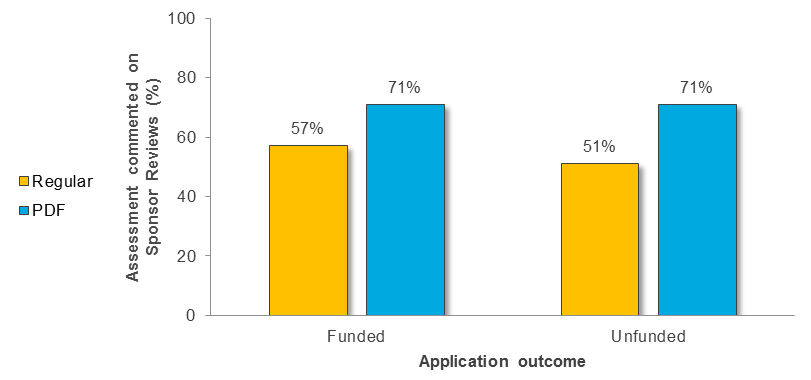
Figure 10 long description
Number and percentage of assessments provided by Regular versus PDF reviewers that commented on the “Sponsor Reviews” criterion across funded and unfunded applications.
Funded Applications Unfunded Applications Regular Assessment (N=35) PDF Assessment (N=35) Regular Assessment (N=35) PDF Assessment (N=35) Number of Assessments 20 25 18 25 Percent of Total Assessments 57% 71% 51% 71% Figure 11 shows the percentage of Regular versus PDF assessments that used the “Research Training Environment” criterion across funded and unfunded applications.
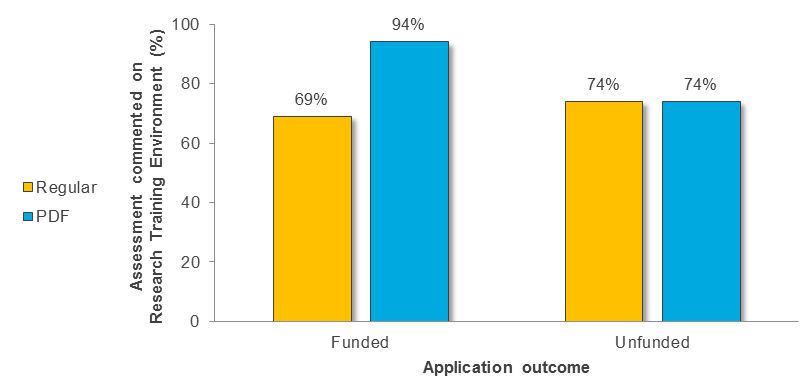
Figure 11 long description
Number and percentage of assessments provided by Regular versus PDF reviewers that commented on the “Research Training Environment” criterion across funded and unfunded applications.
Funded Applications Unfunded Applications Regular Assessment (N=35) PDF Assessment (N=35) Regular Assessment (N=35) PDF Assessment (N=35) Number of Assessments 24 33 26 26 Percent of Total Assessments 69% 94% 74% 74% Criterion 3: Identification of strengths and weaknesses
Figure 12 shows the percentage of Regular versus PDF assessments identifying application strength(s) across funded and unfunded applications.
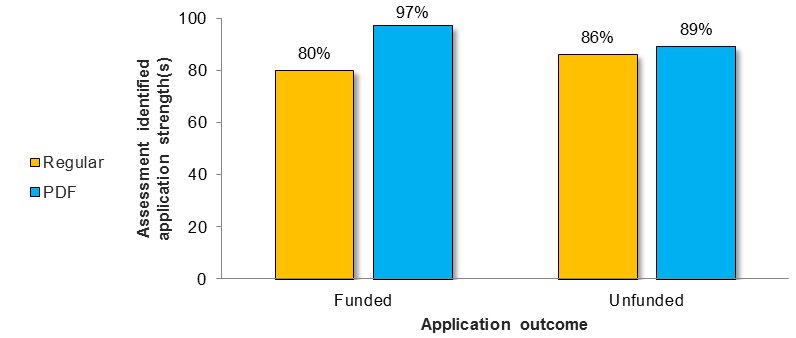
Figure 12 long description
Number and percentage of assessments provided by Regular versus PDF reviewers across funded and unfunded applications that identified application strength(s).
Funded Applications Unfunded Applications Regular Assessment (N=35) PDF Assessment (N=35) Regular Assessment (N=35) PDF Assessment (N=35) Number of Assessments 28 34 30 31 Percent of Total Assessments 80% 97% 86% 89% Figure 13 shows the percentage of Regular versus PDF assessments identifying application weakness(es) across funded and unfunded applications.
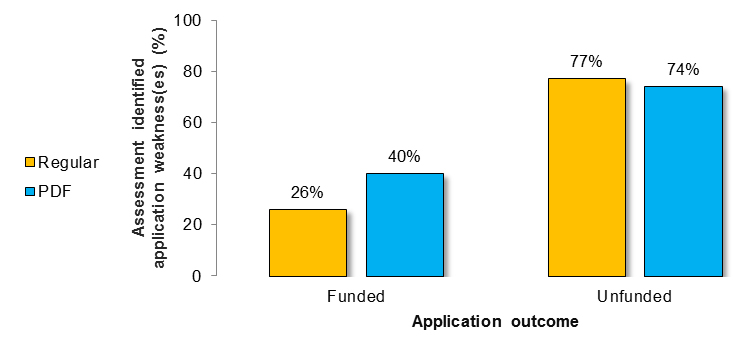
Figure 13 long description
Number and percentage of assessments provided by Regular versus PDF reviewers across funded and unfunded applications that identified application weakness(es).
Funded Applications Unfunded Applications Regular Assessment (N=35) PDF Assessment (N=35) Regular Assessment (N=35) PDF Assessment (N=35) Number of Assessments 10 14 27 26 Percent of Total Assessments 26% 40% 77% 74% B. Utility: as determined by the provision of advice
Figure 14 shows the percentage of Regular versus PDF assessments that offered advice to the applicant across funded and unfunded applications.
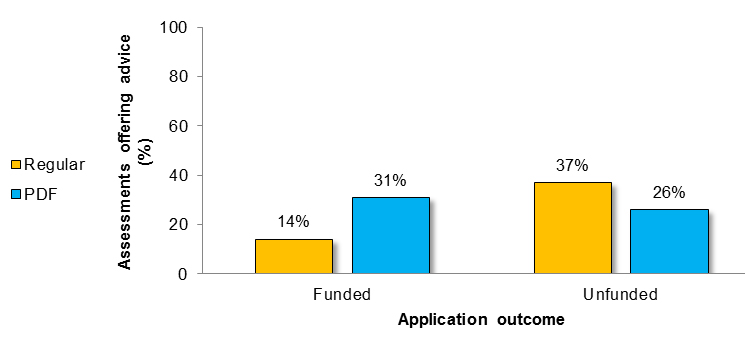
Figure 14 long description
Number and percentage of assessments provided by Regular versus PDF reviewers that offered advice to the applicant across funded and unfunded applications.
Funded Applications Unfunded Applications Regular Assessment (N=35) PDF Assessment (N=35) Regular Assessment (N=35) PDF Assessment (N=35) Number of Assessments 5 11 13 9 Percent of Total Assessments 14% 31% 37% 26% -
C. Comparison of the Peer Review Experience – Feedback Survey Analysis
Following the competition, a survey was sent out to all reviewers of the 2016 and 2017 DRA competitions to assess reviewer experience and to identify successes and challenges of the peer review pilot. For both pilots 1 and 2, PDF survey respondents indicated that they benefitted from the experience and that they would like additional experience. Furthermore, PDFs for both pilots 1 and 2 indicated feeling prepared after reviewing the CIHR peer review guidance and learning material.
Table 5 provides survey participation comparison between the two reviewer groups:
Pilot 1 Pilot 2 Regular Reviewers PDF Reviewers (BPF) Total Regular Reviewers PDF Reviewers (BPF + MFE) Total Total # of reviewers 191 47 238 200 50 250 Total # who completed the survey 83 25 108 90 40 130 Survey completion rate 43% 53% 45% 45% 80% 52% PDF reviewers were asked about their peer review experience through a survey:
"I feel that this peer review experience has helped me with my research career (e.g., grant writing, etc.)"
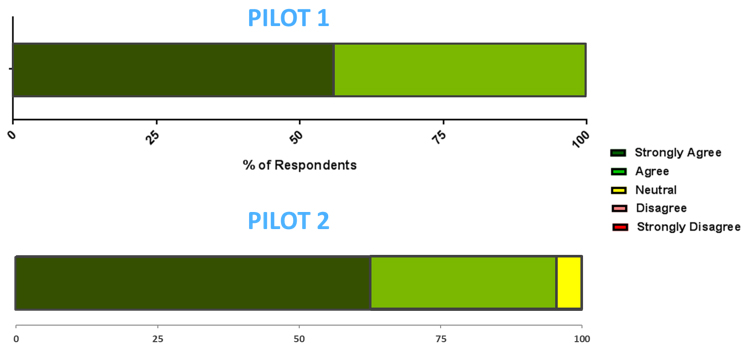
Figure 15 long description
Percentage response to the opinion question following the peer review pilot project: "Please indicate to what extent you agree with the statement: I feel that this peer review experience has helped me with my research career (e.g., grant writing, etc.)".
- Pilot 1: 100% of the respondents agreed with the statement with more than half (56%) of survey respondents indicating strong agreement.
- Pilot 2: 95% of the respondents agreed with the statement with more than half (63%) of survey respondents indicating strong agreement.
"Given the opportunity, I would be interested in reviewing for a CIHR competition in the future"
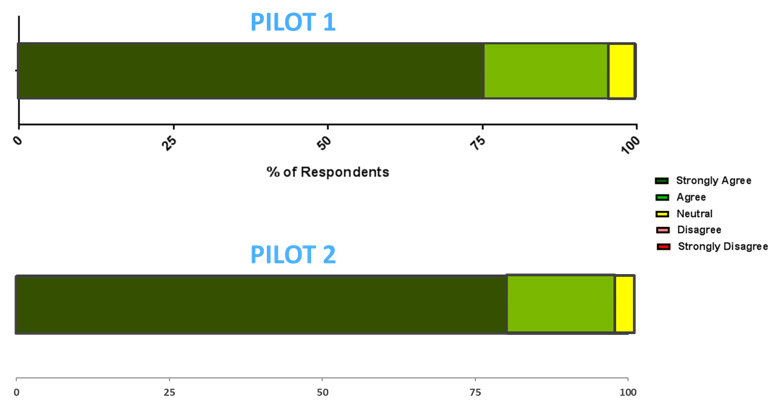
Figure 16 long description
Percentage response to the opinion question following the peer review pilot project: "Please indicate to what extent you agree with the statement: Given the opportunity, I would be interested in reviewing for a CIHR competition in the future".
- Pilot 1: Overall, 96% of survey respondents agreed with the statement, 76% of which agreed strongly.
- Pilot 2: Overall, 97% of survey respondents agreed with the statement, 80% of which agreed strongly.
- Date modified: